


Speculation, momentum, and the challenge for active investors
Equity Market Structure: Part II
Risk-seeking behavior has increased
In part 1 of our equity market structure series, we looked at how rising market concentration and the growth of passive investing have changed the dynamics of today’s equity market landscape. Another important shift has been behavioral: who is driving trading, how risk is being taken, and why that has made the market feel increasingly momentum-driven. Alongside rising concentration and passive flows, risk-seeking behavior has become a more important feature of market structure. In our view, that has helped shape recent returns and created a more difficult backdrop for disciplined active investors.
Our observations, supported by data shared by major global investment banks, suggest that daily trading activity is increasingly driven by retail investors, quantitative strategies, and leveraged products, while the share attributable to traditional active fundamental managers and hedge funds has declined. Recent estimates indicate that, as of June 2026, trading volumes were made up of roughly 40-50% high-frequency trading and market-making activity, 20% quantitative funds, and only 10-20% fundamental investors.1 Similarly, retail traders are now estimated to account for approximately 21% of U.S. trading volumes, up from roughly 10% in 2010, eclipsing the combined share of long-only and hedge fund investors.2
Retail access and speculative activity have changed the market
Risk-on behavior has been amplified by the rise of retail trading, supported by zero-commission offerings, mobile platforms, and broader market access for individual investors (Exhibit 4). While greater access to markets has many benefits, it has also made it easier for less experienced investors to take on more risk. At the same time, rising average daily trading volume in the U.S. options market suggests increased speculative activity. (Exhibit 5). Options are contracts that give investors exposure to the price movements of a stock or index and can be used to make more leveraged, short-term bets. While they can serve legitimate investments purposes, they can also amplify risk-taking.
Exhibit 1: Schwab – Active brokerage accounts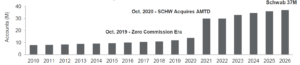
Robinhood – Funded accounts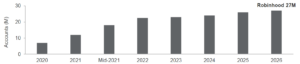 Source: Company data for Robinhood Markets, Inc. and The Charles Schwab Corporation, from Form 10-Q.” Accessed June 2026 via FactSet.
Exhibit 2: Option market ADV since 2023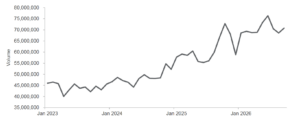 Source: Options Clearing Corporation, “Daily Volume,” OCC Market Data Reports, accessed June 2026.
This matters because short-term price moves are increasingly being shaped by sentiment, positioning, and momentum rather than by company fundamentals alone. In that environment, high-quality companies can underperform in the near term simply because they sit outside the market’s favored themes. For disciplined, long-only investors, this can create frustrating tracking error (periods when a portfolio’s returns diverge from its benchmark). It can also generate attractive entry points for investors who remain selective and patient despite sustained periods of underperformance relative to benchmarks.
Quality has recently lagged, but we view that as cyclical
Factor distortion, particularly the recent underperformance of the quality factor, is the final issue. Quality companies are typically characterized by strong profitability, durable business models, healthy balance sheets, and stable cash flow. More recently, however, the market’s preference for AI-linked leaders, momentum-driven rallies, higher beta, and more speculative stocks has left quality-oriented strategies at a disadvantage (Exhibit 3). In our view, this helps explain why quality-oriented strategies have faced headwinds despite maintaining strong fundamental discipline.
Exhibit 3: Quality factor vs S&P 500, 2021-2025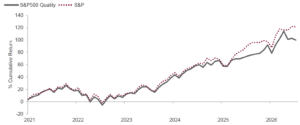 Source: FactSet, as of June 30, 2026. (note: the S&P Quality Index measures the performance of stocks selected on three fundamental measures: return on equity, accruals ratio, and financial leverage ratio. Index constituents are weighted by the product of their market capitalization and quality score).
No single factor outperforms in every environment. Historically, quality has been a durable source of long-term outperformance and downside resilience. We believe the recent period is better understood as part of a cycle rather than a permanent change in what drives long-term equity market returns. The more relevant question for investors is whether the quality factor offers superior risk-adjusted returns over a full market cycle—that is, returns achieved relative to the amount of risk taken. Based on the data, we believe the answer remains yes (Exhibits 4, 5).
Exhibit 4: Quality outperforms over the long-term, Jan. 1995-Dec. 2025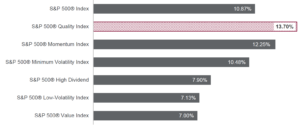 Source: Gateway Investment Advisors. “The Quality Factor: Why Resilience Matters.” Accessed August 19, 2026.
Exhibit 5: Cumulative returns of quality over time, 1995-2025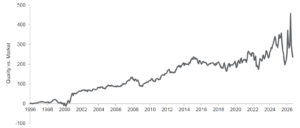 Source: FactSet, as of June 30, 2026.
Our perspective
Recent industry data reflects just how challenging this environment has been. According to data from S&P Dow Jones Indices, 2025 was the fourth-worst year in the last 25 years for active manager relative performance. Morningstar also found only 38% of active managers outperformed their average asset-weighted benchmark in 2025.3 That said, we do not believe the answer is to abandon discipline and chase a narrow group of market leaders. Rather, we believe this environment calls for greater flexibility in portfolio construction while staying grounded in the core principles of high-quality investing.
In our view, today’s market is being shaped by four unusual but interconnected forces:
- historically high index concentration
- continued migration to passive investing
- elevated speculative and flow-driven trading behavior
- temporary factor distortions, especially in quality
Together, these forces have created a more difficult backdrop for active management, particularly for strategies that emphasize quality and disciplined risk control. While today’s market structure has rewarded concentration and momentum more than usual, we believe the combination of market forces is unlikely to persist and may be in its later stages. When leadership begins to broaden, portfolios built on quality, diversification, and valuation discipline are often better positioned to protect capital and compound returns over time.
Our approach to navigating these structural market drivers continues to evolve as market conditions change. At the same time, the core tenants of our investment process remain the same: focus on owning high-quality companies, manage concentration risk carefully, and stay disciplined when markets become overly narrow or momentum-driven. We are incorporating the market structure changes we have observed into our process, while maintaining conviction that owning quality businesses remains one of the most effective ways to deliver strong risk-adjusted returns for clients over time.
1 Metli, Christopher. “MS QDS | Leveragepalooza.” Email message to Sophia Tsilerides, June 4, 2026
2 DeSanctis, Steven G., Daniel T. Fannon, Desh Peramunetilleke, Mahesh Kedia, Jane Gibbons, and Ritwik Roy. The Growing Importance & Impact of the Retail Trader. Equity Research, Global Equity Strategy. New York: Jefferies, December 9, 2025
3 Ganti, Anu R., Davide Di Gioia, Nick Didio, and Liam Flaherty. “U.S. Persistence Scorecard.” S&P Dow Jones Indices. Accessed August 19, 2026

Related insights and perspectives



Financial markets outlook: Third quarter 2026
