




Related solution
Investment management
Turning our investment legacy into
long-term growth for your portfolio.
Energy is most (but not all) of the story
Breaking down the move in commodities by sector
Bloomberg Commodity Index components, percent change year-to-date
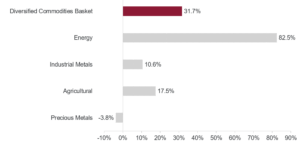
Source: Bloomberg, as of September 23, 2026.
The commodity complex is vast, spanning a broad range of raw materials that are building blocks for the global economy. This year’s rise in many of these prices is part of the persistent inflation story that contributed to the Federal Reserve’s recent interest rate hike.
The top red bar on the chart shows the year-to-date price change in the Bloomberg Commodity Index, which contains 25 components, ranging from oil and copper to cattle and gold. It has risen 32% so far in 2026. The other bars represent the index’s four major sectors. Energy has been the dominant driver, which comes as no surprise given the sharp rise in oil prices since the onset of the conflict with Iran. However, industrial metals and agricultural goods have also posted meaningful gains. By contrast, the precious metals basket, consisting of gold and silver, is down slightly after a huge rally in 2025.
Over the longer term, investors are assessing whether deglobalization, rising infrastructure and electricity demand tied to the AI buildout, and the massive costs associated with ramping up raw material supplies could usher in a secular bull market for the commodity sector.
What we’re watching this week
Wednesday: The Fed’s preferred inflation measure, the August PCE Index, will be released. The annual rate is likely to remain above 3%.
Thursday: The September ISM Manufacturing Survey will be released, with projections pointing to continued expansion in the industrial sector.
Friday: The September employment report will be issued. The consensus among economists is that payrolls increased by about 100,000, a solid gain, though slower than the prior month.


