


Related solution
Investment management
Turning our investment legacy into
long-term growth for your portfolio.
Consumer and commercial banking products and services are offered through CIBC Bank USA. Member FDIC and Equal Housing Lender. All loans are subject to credit approval. Trust services and investment products are offered by CIBC Private Wealth Management. CIBC Private Wealth Management includes CIBC National Trust Company, CIBC Delaware Trust Company and CIBC Private Wealth Advisors, Inc. (a registered investment adviser) all of which are wholly owned subsidiaries of CIBC Private Wealth Group, LLC — and the private banking division of CIBC Bank USA. Trust services and investment products are not FDIC insured, not deposits or obligations of, or guaranteed by, CIBC Bank USA or CIBC National Trust Company, and are subject to investment risk, including loss of principal.
Commercial real estate products and services offered by CIBC Bank USA and CIBC Inc.
CIBC Capital Markets is a trademark brand name under which CIBC and some of its subsidiaries, including CIBC World Markets Inc., CIBC World Markets Corp. and CIBC Bank USA, provide different products and services. Capital Markets products are not FDIC insured; not deposits or obligations of, or guaranteed by, CIBC Bank USA; and are subject to investment risk, including loss of principal.
This website is not intended for use by residents of the European Union (EU).




The CIBC Logo is a registered trademark of CIBC, used under license.
©2026 CIBC Bank USA.
Fixed income allocations serve important roles within balanced stock-bond portfolios. They typically produce steady cash flows, repay principal reliably, and hold their value during large equity market selloffs. Private lending strategies often share these characteristics, and their benefits tend to be most pronounced in certain environments—such as those in which inflation is elevated, the Federal Reserve (Fed) is hiking rates, federal debt concerns are growing, and equity bull markets have persisted for extended periods. At such times, an allocation to private lending can be particularly impactful, improving both the diversification and return profile of a balanced portfolio.
While many bond allocations focus on medium-term fixed-rate investments, private lending strategies typically invest a large percentage of capital in higher-yielding floating-rate notes. These notes make quarterly interest payments linked to a short-term benchmark that closely follows the Fed’s target policy rate.1 When the Fed increases its target rate by 0.25%—as it did on September 16—owners of private floating-rate loans receive comparable increases in coupon payments thereafter. Additionally, because the coupon rate moves with prevailing rates, floating-rate loans tend to hold their value well in rising-rate environments, in meaningful contrast to the price declines typically seen in medium- and long-term fixed-rate bonds.
For investors looking to (i) receive higher coupon payments and (ii) maintain more stable portfolio values amid rising rates, a partial reallocation from bonds to private lending can help achieve both objectives. This type of reallocation benefited many investors in 2022-2023. During this period, geopolitical developments, labor shortages, and other factors drove inflation rates to approximately 7-9%,2 the highest levels in more than 40 years. In response, the Fed tightened monetary policy aggressively, raising rates by 5.25 percentage points. Despite these headwinds, private lending recorded steady, positive total returns, while traditional bonds, leveraged loans, and high-yield bonds lagged meaningfully.
Figure 1: Private lending vs. Bonds
2022-2023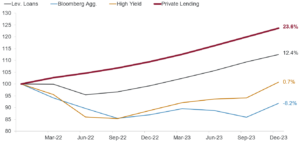
Source: Data sourced from FactSet and Bloomberg and covers the period from 12/31/2021 to 12/31/2023. Definitions: Lev. Loans refers to the Morningstar LSTA US Leveraged Loan Index TR. Bloomberg Agg. refers to the Bloomberg U.S. Aggregate Total Return Value Unhedged USD Index. High Yield refers to the ICE BofA U.S. High Yield Index. Private Lending refers to the Cliffwater Direct Lending Index. Assumes principal recycling and income reinvestment.
Though bonds have maintained low or negative correlations to stocks in many market environments, this pairing may not always behave in a low-correlation manner. In fact, throughout much of the 1980s and 1990s, the correlation between traditional bonds and stocks was moderately positive.
Figure 2: Rolling 12-month correlations between equity and bond markets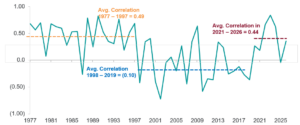
Source: Shows the 12-month correlation between monthly returns of the Bloomberg US Aggregate Total Return Index and the S&P 500 Total Return Index, calculated at each calendar year end. The dashed line represents the average of these year-end correlations over the period shown. Source: Bloomberg, data retrieved September 10, 2026.
This positive-correlation dynamic returned in 2021-2024, with particularly poor returns for traditional stock-bond portfolios in 2022. In contrast, private lending generated stable, positive returns throughout that period.
Figure 3: Private lending returns vs. stock and bond returns
in periods of high stock-bond correlation, 2021-2024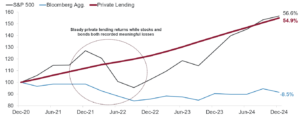
Source: Data sourced from FactSet and Bloomberg and covers the period from 12/31/2021 to 12/31/2023. Definitions: Bloomberg Agg. refers to the Bloomberg U.S. Aggregate Total Return Value Unhedged USD Index. Private Lending refers to the Cliffwater Direct Lending Index. Assumes principal recycling and income reinvestment.
Stock and bond returns during the rate-hike cycle of 1994-1995 share some similarities with those of 2022. Heading into 1994, the U.S. economy was growing at an above-average annual rate and unemployment had declined significantly. This strength in employment had begun to result in labor shortages and upward wage pressures. To dampen the associated inflation pressure, the Fed hiked rates by three percentage points over the course of the year.
However, much like in 2022, this shift in policy and policy expectations occurred relatively quickly, catching many investors off-guard and exacerbating the repricing of equities and bonds. Though the aggregate loss on a balanced stock-bond portfolio was relatively small in 1994, the underperformance relative to portfolio targets—often in the 6-8% range—was significant. Balanced portfolios would likely have benefited from exposure to a less correlated investment with floating-rate coupons and compelling credit spreads.
Figure 4: Stock and bond losses amid 1994 rate hikes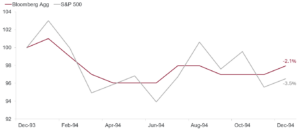
Source: Data sourced from FactSet and Bloomberg and covers the period from 12/31/1993 to 12/31/1994. Definitions: Bloomberg Agg. refers to the Bloomberg U.S. Aggregate Total Return Value Unhedged USD Index. S&P 500 refers to the S&P 500 Total Return Index. Assumes principal recycling and income reinvestment.
Other rate-hike cycles have not resulted in balanced portfolio returns as weak as those in 1994 or 2022, but there are important differentiating factors behind those outcomes that highlight key aspects of today’s environment.
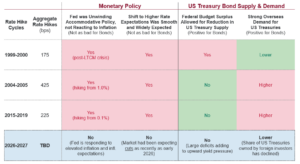
See the end of the article for more details about each period.
While productivity gains from artificial intelligence (AI) may offset some pressure on inflation and yields, the multiple factors noted above point to elevated risks of high inflation expectations, high volatility, upward pressure on bond yields, downward pressure on bond prices, and flat or negative returns in bond markets.
Given the differences between today’s environment and the three rate-hike cycles from 1999-2019, we believe the cycle initiated on September 16 will share more similarities with the challenging environments of 1994 and 2022. Admittedly, we may not see as many rate hikes in this cycle as we did in 1994 and 2022, and we will likely experience novel effects from increased AI adoption. However, with current inflationary pressures, elevated U.S. bond supply, and concerns about federal debt sustainability, fixed income allocations appear less well positioned to provide the cushion against equity market dislocations that many investors expect when adding bonds to a portfolio.
To reduce exposure to this risk and increase expected returns, we recommend that investors reallocate a portion of their portfolios to private lending strategies. This reallocation would enable investors to benefit from private loans’ floating-rate coupons, relatively stable pricing, and low expected correlation to stocks during bear markets, all of which contribute to stronger portfolio returns and improved risk-adjusted returns in balanced portfolios.
Figure 5: Private lending returns vs. stocks & bonds
2016-2026, annualized returns on the right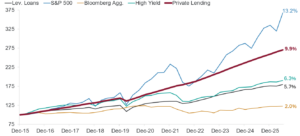
Source: Data sourced from FactSet and Bloomberg through June 2025. Definitions: Lev. Loans refers to the Morningstar LSTA US Leveraged Loan Index TR. Bloomberg Agg. refers to the Bloomberg U.S. Aggregate Total Return Value Unhedged USD Index. High Yield refers to the ICE BofA U.S. High Yield Index. Private Lending refers to the Cliffwater Direct Lending Index. Assumes principal recycling and income reinvestment.
1999-2000
Though the Fed hiked rates by 1.75 percentage points, stock and bond returns remained relatively strong. Investors viewed the hikes as an unwind of emergency stimulus from 1998 rather than an inflation-related policy change. Additionally, the federal government was running a budget surplus at the time, allowing the Treasury to use excess revenues to repurchase long-dated bonds and reduce short-term debt issuance—both positives for bond prices. Lastly, increased internet usage triggered expectations of (i) productivity gains, (ii) a corresponding decline in inflation, and (iii) well-supported bond prices.
2004-2005
Despite 4.25 percentage points of aggregate rate hikes, stock and bond returns remained resilient—benefiting from the (i) gradual, predictable execution of this rate-hike cycle and (ii) rapid influx of overseas demand for US Treasuries. The latter helped contain intermediate and long-dated yields at a time when they may have otherwise been pressured higher by monetary policy tightening.
2015-2019
The Fed hiked rates more than 2.25 percentage points to 2.40%. Both stocks and bonds benefited from the (i) slow, highly telegraphed execution of this tightening and (ii) low, well-anchored inflation expectations at the time. Additionally, stocks benefited from (i) an extended period of cheap financing for growth initiatives and (ii) expansionary fiscal policies that supported corporations and underlying consumers.
1 Typically the 1-month or 3-month Secured Overnight Financing Rate (SOFR).
2 The headline consumer price index (CPI) and personal consumption expenditures (PCE) indices peaked in June 2022 at 9.1% and 7.1%, respectively. Sources: US Bureau of Labor Statistics and YCharts, respectively.
3 In 1998, the Fed provided stimulus to ease financial stress following the sudden collapse of a large, derivatives-focused asset management firm, Long Term Capital Management (LTCM), from which contagion spread rapidly.


