



Why today’s equity market feels so different
Equity Market Structure: Part I
The U.S. stock market is no longer playing by the same rules it was five years ago. While the S&P 500 remains an important measure of market performance, the sources of returns and risk have become increasingly concentrated in a small group of large technology companies, particularly those with ties to the artificial intelligence (AI) theme. At the same time, heavy flows into passive investment vehicles have become another powerful force shaping markets.
Alongside rising speculative activity (investing in riskier assets in search of quicker returns) and the market rewarding certain characteristics, these trends have created a more difficult backdrop for active managers in recent years.
While these pressures are real, we believe some of them to be temporary. They do not invalidate the case for fundamental, bottom-up investing. If anything, they reinforce the value of disciplined portfolio construction, thoughtful security selection, and a focus on high-quality companies.
Market concentration has reached a historical high
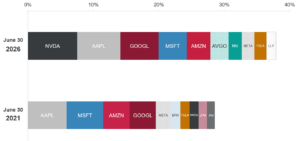
One of the most important shifts in market structure has been the sharp rise in index concentration. As of June 30, 2026, the top 10 stocks in the S&P 500 represented approximately 38% of the index, up from about 29% five years prior. That increase has been driven largely by a narrow group of mega-cap technology and AI-related companies. This concentration has altered the benchmark’s risk profile (Exhibit 1).
Exhibit 1: S&P 500 – Top 10 company weights
Source: FactSet, as of June 30, 2026.
A growing share of market return and beta, or overall sensitivity to market movement, now comes from a smaller number of stocks. For active managers running diversified portfolios, that can make it increasingly difficult to keep pace with the benchmark without owning or overweighting those same names. This level of concentration is unprecedented—roughly three times the long-run average.1
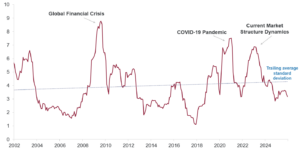
Our analysis suggests that market volatility has increased alongside it. Over the five year period ending December 2025, monthly market returns showed a notable increase in variability. In fact, 40 of those 60 months had a rolling standard deviation (a measure of risk and volatility) greater than the historical median (Exhibit 2). In other words, market risk has increased at the same time the market has become more concentrated. For active managers, that creates a challenge.
Exhibit 2: TTM rolling standard deviation of monthly returns, S&P 500
Source: FactSet, as of June 30, 2026.
Diversification, valuation discipline, and risk controls can become short-term headwinds when market leadership is unusually narrow. Still, concentration tends to be cyclical, and periods like this often create opportunity for patient investors with a long-term outlook. These concentrated market conditions can also amplify downside risk if volatility returns. Similar to the dot-com bubble era that culminated in the Nasdaq losing approximately 80% of its value from its peak in March 2000, history offers a reminder that narrow leadership can reverse sharply.
Passive flows are increasingly influencing prices
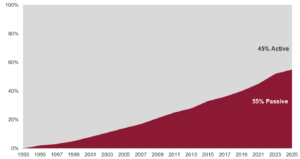
Another major structural shift has been the continued move from active investing to passive. Passive investing, typically index funds and exchange-traded funds (ETFs), seek to track an index rather than select stocks based on company-specific fundamentals. Passive strategies now account for roughly 55% of U.S. equity assets under management, up from 30% a decade ago. Some prominent investors have suggested that the true share may be even higher. From 2016 to 2025, index-linked U.S. equity products gathered $2.9 trillion in net inflows, while actively managed funds saw $3.4 trillion in net outflows.2
Exhibit 3: US Equity mutual fund and ETF AUM: Active vs. passive share, 1993-2025
Source: Bendit, Charles, and Henry Hayden. Information Services: Dispersion. Rothschild & Co Redburn, June 18, 2026
These flow dynamics are worth noting because passive vehicles allocate capital based on market capitalization, in other words, based on a company’s size in the index, rather than on valuation or underlying stock fundamentals. As more money moves into passive products, the largest stocks receive the largest inflows, reinforcing existing index leadership. Over time, this can weaken traditional price discovery, the process by which security prices reflect a company’s fundamentals, and make markets more sensitive to flows and momentum. It also contributes meaningfully to the concentration dynamics shaping today’s index performance. Said differently, a select group of companies has continued to outperform, grow larger, and attract even more investor capital.
As those companies rise in market value, their index weights increase, which can draw in further passive investment. This creates a self-reinforcing cycle. The effect can be exacerbated by what are referred to as inelastic fund flows: continuous, price-insensitive inflows into passive vehicles that buy stocks in proportion to their index weight, regardless of underlying fundamentals or valuation. In our view, this has contributed to passive outperformance relative to active in recent years, while making conditions more challenging for active managers focused on valuation, quality, and downside risk protection.
Our takeaway
Today’s market has rewarded larger-cap stocks, positive momentum, and high-concentration more than usual. That has made life more difficult for diversified active investors, especially those unwilling to chase an increasingly narrow group of leaders. Even so, we do not see this as a permanent change in how markets function. Periods of extreme concentration have historically given way to broader leadership over time. In that context, discipline, diversification, and a focus on quality remain as important as ever.
In Part II of our market structure series, we’ll turn to the behavioral side of the story: how speculative trading, retail participation, and momentum-driven positioning have influenced returns, why quality has fallen out of favor, and why we believe those trends won’t last forever.
1 Sean Burns, The Beta Deficit: Why Portfolios Can’t Keep Pace, HOLT Portfolio & Quantitative Strategy (New York: UBS Securities LLC, June 23, 2026)
2 Bendit, Charles, and Henry Hayden. Information Services: Dispersion. Rothschild & Co Redburn, June 18, 2026

Related insights and perspectives



Financial markets outlook: Third quarter 2026
